New QubeSight is now on AWS Marketplace →
Data Activity Monitoring

Complete visibility into
data activity.

QubeSight shows who touched which data, from where and how. It centrally collects all activity across your databases (user, source IP, SQL statement and object accessed), parses every query, detects risky access to sensitive data in real time and produces verifiable evidence for audits. It works alongside IBM Guardium or on its own, and your data stays on your infrastructure.

  • 13,500events/s · measured on 2 workers, 8 vCPU
  • 46 msone record out of 28.6 million · test environment
  • 0lost records · in node-loss testing
  • 13built-in detection categories · enabled at install

Lab measurements. The capacity of your own environment can be measured in the product under Settings → Benchmark.

IBM GuardiumPostgreSQL auditMongoDB auditCouchbase auditSyslog · TCP/UDP/TLSSNMPFilebeatKafkaAWS KinesisAzure Event HubLDAP / ADOktaEntra IDKeycloakSIEMS3 Object LockSFTP
Performance

One record out of 28.6 million:
46 milliseconds.

QubeSight stores records in a compressed, columnar format, so each query reads only the columns it needs. Searches and reports that can take minutes in traditional database activity monitoring tools built on row-based storage complete in under a second with QubeSight.

46 mssingle record by time and ID
153 mstop 10 users across the full history
< 1 sfree-text search across 28.6 million SQL statements
query times · 28.6 M records · test environment MEASURED
Fetch a single recordby time and record ID · all columns
46 ms
A user's last 100 operationswithin the last 30 days
59 ms
Top 10 most active usersfull history · 28.6 M records
153 ms
Lookup by record ID onlyno time range · full table scan
244 ms
Daily operation breakdown for one year23.8 M records
526 ms
Free-text search in SQL text28.6 M records · 2 GB of text
774 ms
01 second

Test environment measurement (November 2026): 8 vCPU server, 6 ClickHouse threads and about 5.6 GB of memory, with live ingestion running. Each query was run 7 times; the server-side median is shown.

How it works

From detection to evidence:
the lifecycle of an incident.

Example scenario: a service account accesses card data outside business hours, from a client it has never used before. Follow, step by step, how QubeSight collects the event, analyses it, raises an alert and turns it into audit evidence.

03:12:04

The session is recorded.

app_batch is a service account that normally connects during business hours from the same application server. In this scenario it connects from a previously unseen IP address, using a desktop SQL client.

QubeSight maintains a behavioural baseline for every account by time, source and client, and records any deviation from it.

03:12:09

The event enters the pipeline.

The activity record arrives from IBM Guardium via syslog, SNMP or archive, or from the database's native audit log. Vector parses it, Redpanda queues it, the worker analyses it and ClickHouse stores it.

The pipeline is designed to be lossless: new records are never deleted, even when disk capacity runs out.

03:12:10

The SQL statement is parsed.

The worker parses each statement into a syntax tree rather than matching text, identifying every object accessed, including tables in joins and subqueries.

The sensitive data catalogue recognises the national_id and pan columns and maps them to the applicable regulation, such as PCI DSS.

03:12:11

Rules are evaluated.

Each record is evaluated against the rule set as it is written. Built-in detections cover brute-force attempts, SQL injection, bulk deletion, privilege escalation and insider data exfiltration, and organisation-specific rules can be added.

In this example all four conditions are met, so the event is classified as critical.

03:12:12

The right teams are notified.

The alert is delivered through the configured channels: email, syslog over TLS to your SIEM, or webhook. Notifications can be sent in English or Turkish.

A false positive can be turned into a suppression rule in a single step, using the link in the alert email.

03:14

The incident is investigated in one view.

Mindmap shows the user's sessions with their open and close times, the statements in each session, the tables accessed and any violations, all in a single view.

Security operations teams can assess the scope of an incident in minutes, without sifting through raw logs.

09:00

Audit evidence is ready.

Records are retained in an immutable archive, and Guardium archives are verified with SHA-256. A signed evidence pack can be provided directly in response to an audit request.

Evidence for PCI DSS and data-protection audits is available from the moment the event occurs.

Try it

Enter a SQL statement.
See what QubeSight detects.

The analysis runs entirely in your browser; nothing you enter is sent anywhere.

query.sql 0 characters

A simplified in-browser demo. QubeSight itself uses a full SQL syntax tree and built-in classification rules.

—
Analysing…
operation
tables
sensitive columns
detections
    sample record (JSON)
    
            
    Noise management

    Handle alert noise
    from your inbox, in one step.

    When the record volume from a source rises above its normal level, QubeSight detects it and asks the responsible person by email. Handling false positives and expected peaks does not require logging in to the console; the button in the email is enough.

    01 · Detect

    A sudden increase is identified

    Volume over the last hours is compared with a 7-day baseline, identifying the combination of user, source IP and application that exceeds its normal level.

    02 · Notify

    The owner is asked by email

    The email states the size of the increase, the source affected and the recommended action. The decision is made with the button in the email, without signing in.

    03 · Act

    Applied in one step Enterprise

    The ignore period is chosen on the confirmation screen. The rule is added to the Guardium policy automatically and removed when the period ends. Every decision is kept in the audit log.

    AI

    Describe the report.
    QubeSight builds it.

    The built-in assistant turns a request written in plain language into a report query. The model runs on your premises and no data leaves your network. You can also connect your organisation's own language model.

    Reports by description

    Just write what you need. The assistant determines the user, operation, object and time-range filters, summarises the result and opens the report in the Reports screen with one click, where it can be exported or added to a scheduled delivery.

    Integration with your own model

    QubeSight works with your existing AI infrastructure: it provides data, supports analysis and triggers action workflows. A local model is used by default, and no data is sent outside your organisation.

    Product

    From collection to audit,
    one platform.

    The screens below are taken directly from the product.

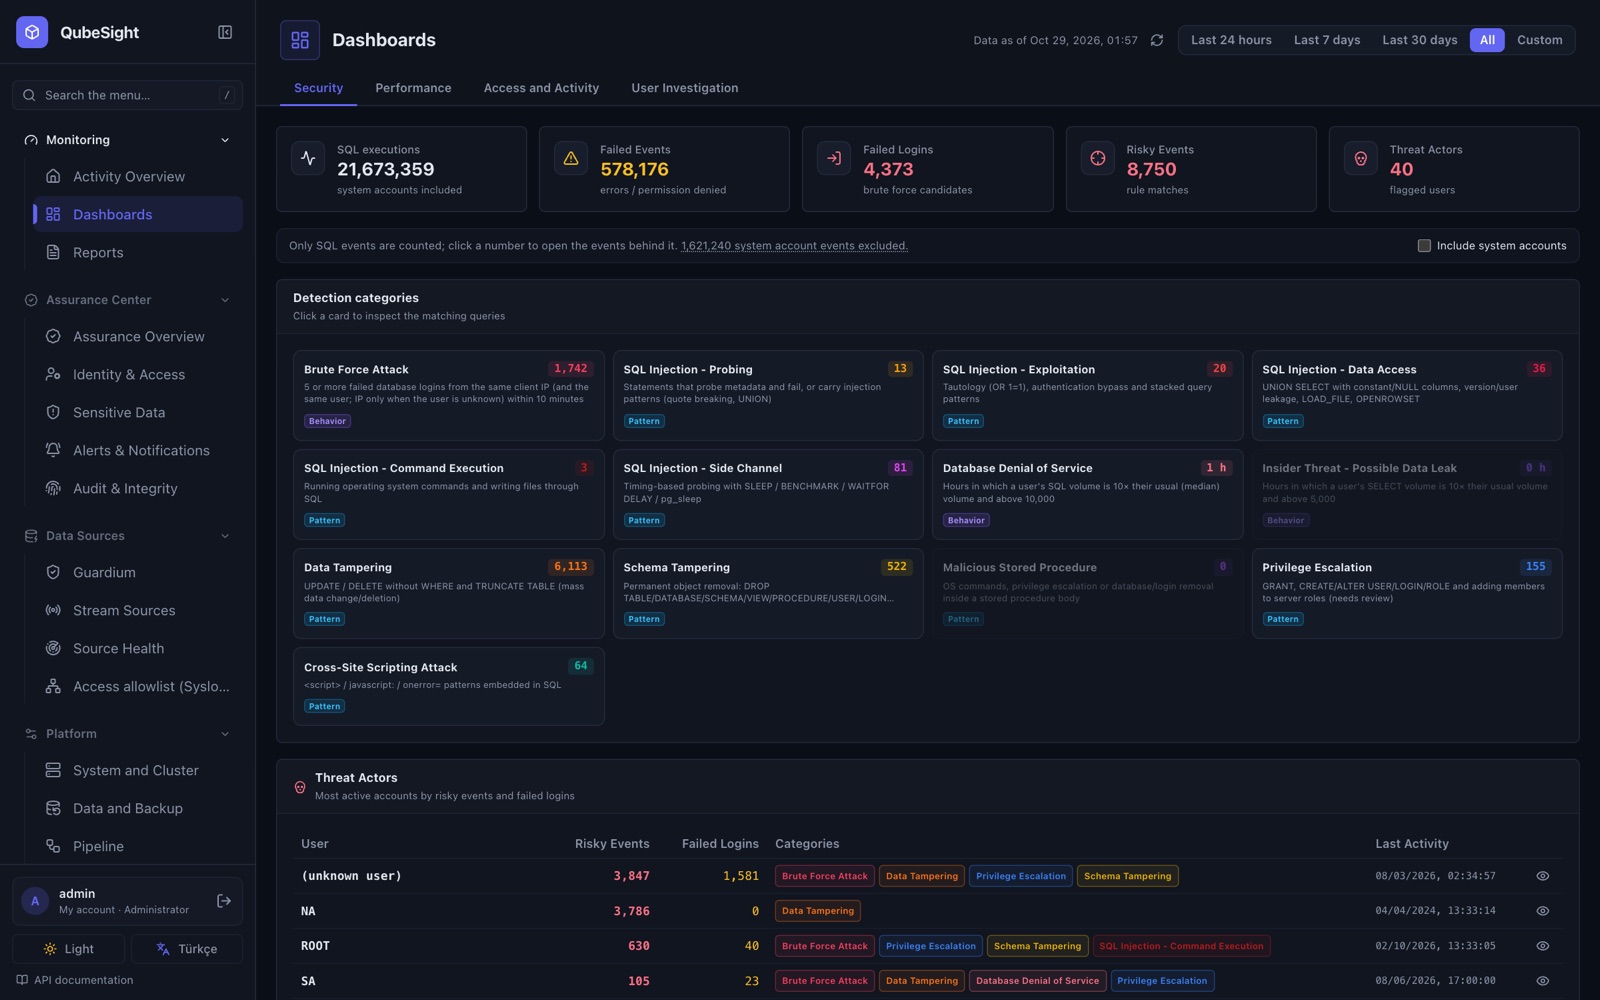
    01 · Detect

    13 detection categories, enabled at install.

    Brute-force attempts, five types of SQL injection, bulk deletion, schema changes, privilege escalation and insider data exfiltration are monitored out of the box. Every indicator can be drilled down to the underlying statements.

    • DB_ALERT rule engine with pattern and behaviour-based detections
    • Rules scoped to sensitive data groups
    • High-risk accounts and their recent activity in one view
    QubeSight security dashboard: detection categories and high-risk accounts
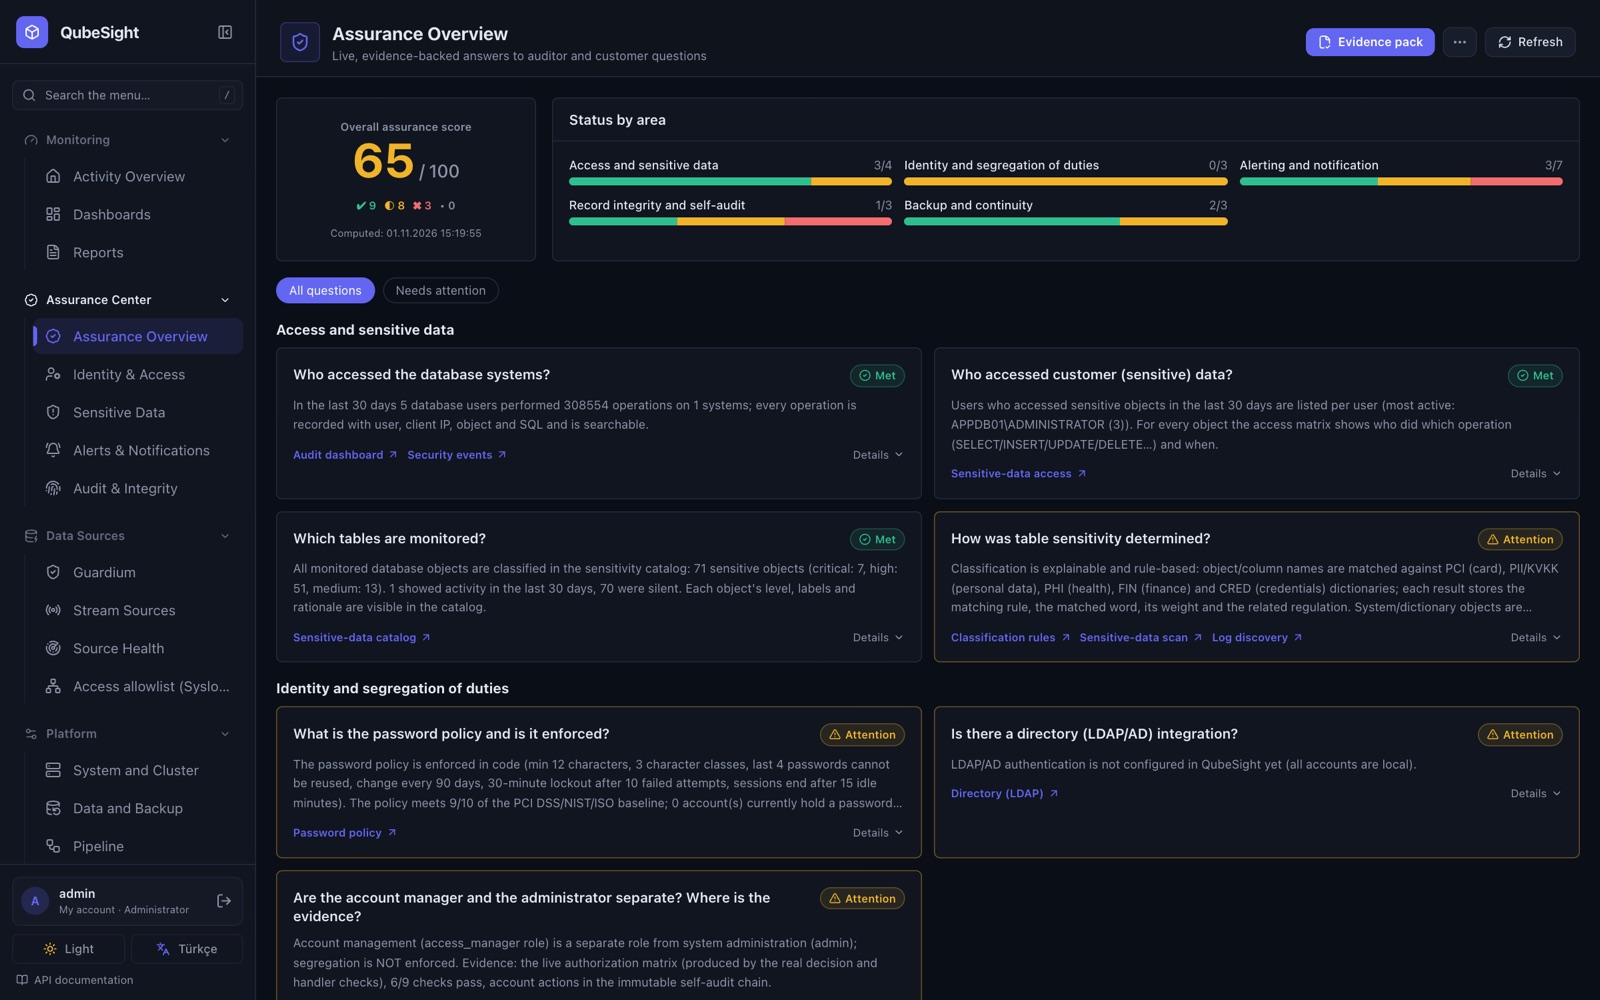
    02 · Audit

    Answer audit questions with live data.

    The Assurance Center answers audit questions such as who accessed sensitive data, whether segregation of duties is in place and whether backups have been verified, using live data, and summarises them in a single assurance score.

    • Evidence for PCI DSS and data-protection audits
    • Immutable archive: records held in locked storage
    • Signed evidence pack Enterprise
    QubeSight Assurance Center: assurance score and audit questions
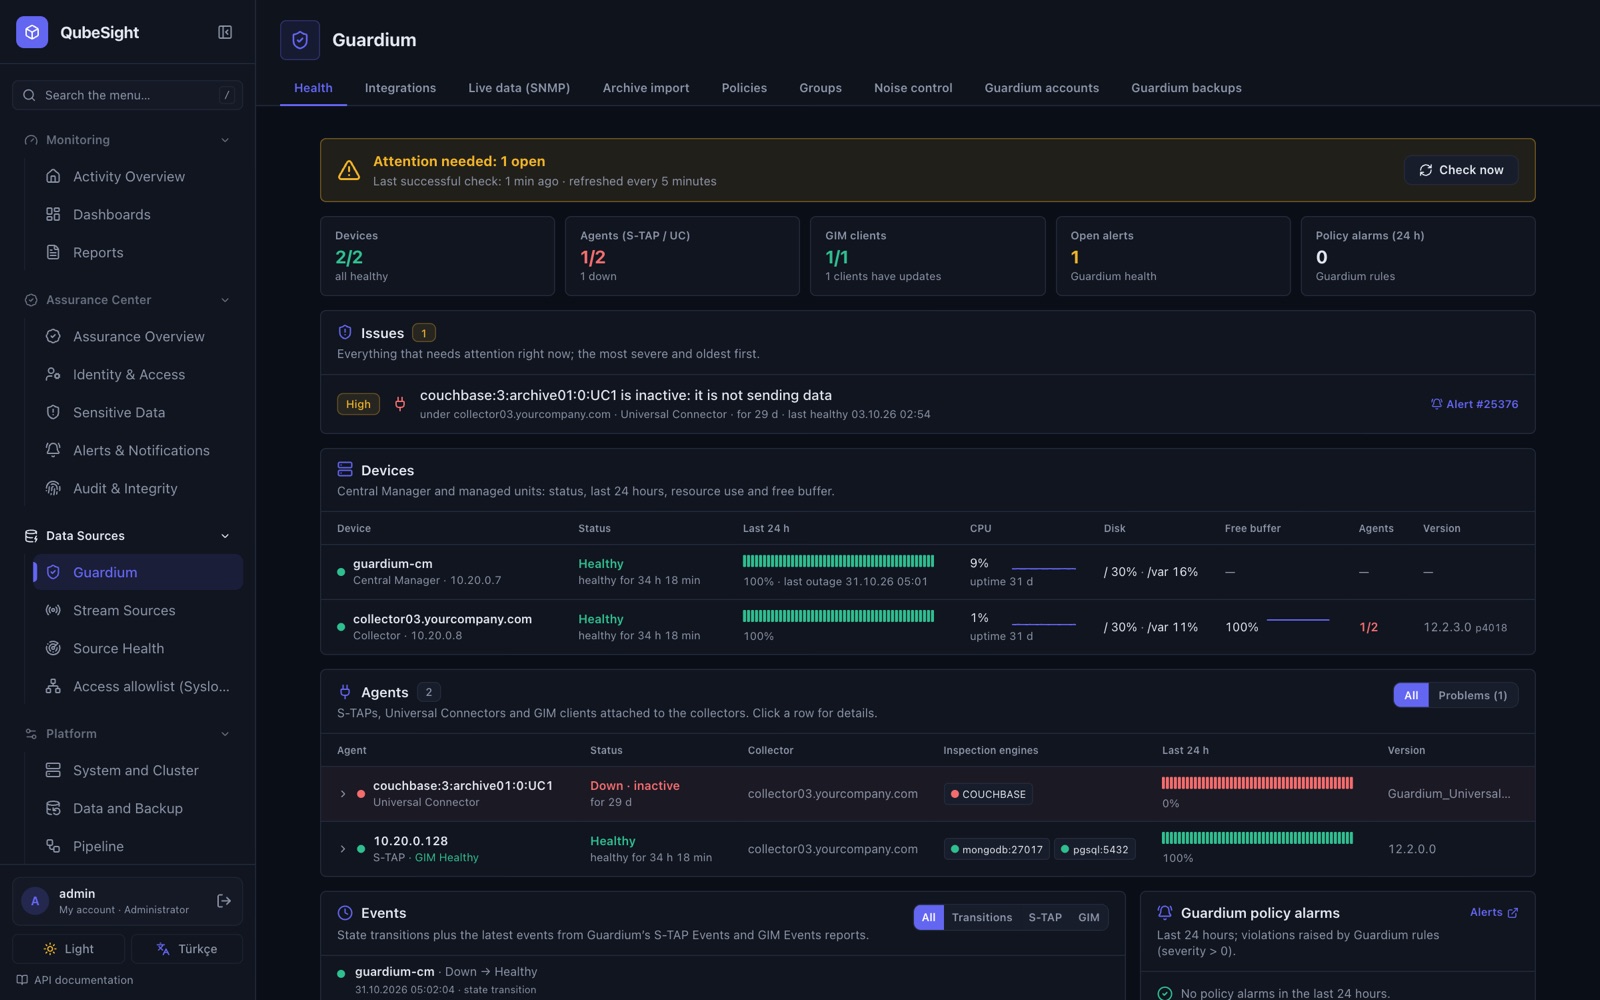
    03 · IBM Guardium

    Extends your existing Guardium investment.

    QubeSight ingests Guardium data in real time via syslog and SNMP, restores Guardium archives and verifies every archive file with SHA-256. It continuously monitors the health of your Guardium infrastructure and reports issues as they occur.

    • Real-time ingestion via syslog and SNMP
    • Guardium archive restore with row-level integrity checks between archive and database
    • Real-time health monitoring and automated daily restore Enterprise
    QubeSight Guardium health screen
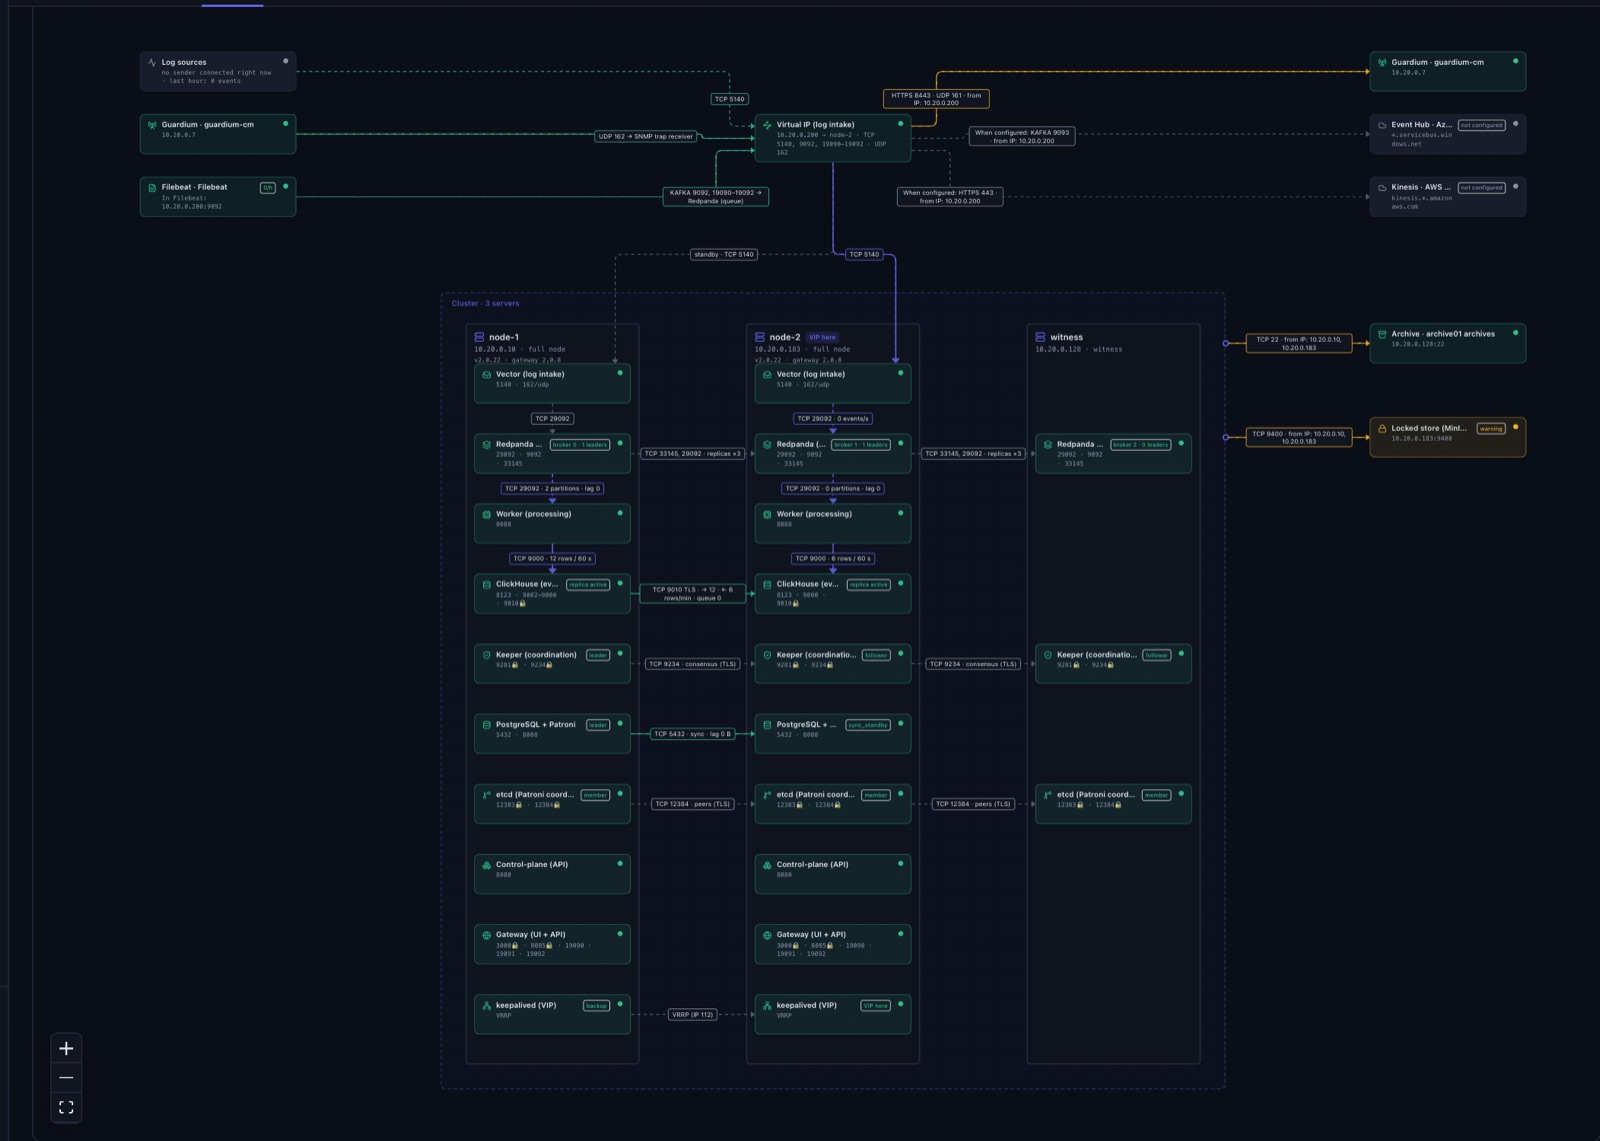
    04 · Resilience

    Clustered architecture with no data loss on node failure.

    Runs on three nodes, or two nodes plus a witness: virtual IP, replicated ClickHouse and PostgreSQL, and automatic failover. The live cluster map shows connections between services down to the port level.

    • High availability and disaster recovery Enterprise
    • Encrypted, verified backups and restore testing
    • Signed updates with automatic rollback on failure
    QubeSight live cluster map: nodes, services and ports
    Integrations

    Works with your existing infrastructure.

    No additional agent rollout is required. QubeSight ingests from the log sources you already have and delivers to the channels you already use.

    sources IBM Guardium syslog · SNMP · archive PostgreSQL audit MongoDB audit Couchbase audit Syslog TCP · UDP · TLS Filebeat · Kafka AWS Kinesis Azure Event Hub
    outputs and identity Email SMTP · STARTTLS SIEM syslog TLS Webhook LDAP / Active Directory SSO Okta · Entra ID · Keycloak S3 / MinIO Object Lock SFTP backup copy REST API OpenAPI
    Security

    Your data stays on your infrastructure.

    No QubeSight cloud account, no outbound telemetry and no third-party service dependency. Designed with the requirements of financial services and the public sector in mind.

    01

    On-premises

    An offline installation package that needs no internet access; a browser-based setup wizard or a single command.

    02

    TLS end to end

    The web interface, intra-cluster traffic, Kafka (SASL/SCRAM) and syslog transport are all encrypted.

    03

    Identity management

    LDAP / Active Directory, enterprise SSO, built-in two-factor authentication and segregation of duties.

    04

    Signed updates

    Ed25519-signed patches; the new version starts alongside the current one and rolls back automatically on failure.

    Editions

    Start with Community,
    move to Enterprise when you need it.

    Licensing is based on the number of monitored databases, not on log volume. Both editions are also available on AWS Marketplace.

    Community

    BSL 1.1 · free

    Freeno database limit

    • Log collection via syslog, Filebeat and Kafka
    • SQL parsing and the DB_ALERT rule engine
    • 13 detection categories, dashboards, reports and Mindmap
    • Sensitive data discovery from logs
    • Manual Guardium archive restore
    • LDAP, MFA, email and webhook alerts
    • AI assistant: reports by description (local model; data never leaves your network)
    Source code · coming soon

    Enterprise

    recommended

    Per databaseannual subscription · request a quote

    • Everything in Community, plus:
    • SSO (OIDC), segregation of duties, granular permissions
    • Active sensitive data scanning
    • Noise management: time-limited ignore in one step from the email
    • Automated Guardium restore and real-time health monitoring
    • Scheduled PDF/CSV report delivery and compliance packs
    • High-availability cluster and disaster recovery
    • External immutable archive and signed evidence pack
    • Cloud sources (Kinesis, Event Hub), advanced alert channels and enterprise support
    Request a quote
    AWS Marketplace

    On AWS Marketplace: in your own AWS account, with a single CloudFormation stack.

    The Community and Enterprise editions are available on AWS Marketplace. QubeSight runs on a single EC2 instance in your account, and your data never leaves it.

    • All passwords and keys are generated on the instance at first boot; the initial admin password is delivered through AWS Secrets Manager
    • In Enterprise, the immutable archive is kept in an S3 Object Lock bucket created by the stack
    • Amazon RDS and Aurora Database Activity Streams are collected through Kinesis
    • Enterprise contracts are priced per monitored database and billed through your AWS account

    Monitor data activity in real time
    and be audit-ready at all times.

    Let us show you how QubeSight works with your own Guardium or audit logs in a 30-minute session.

    or write to us directly at info@fklabs.co.